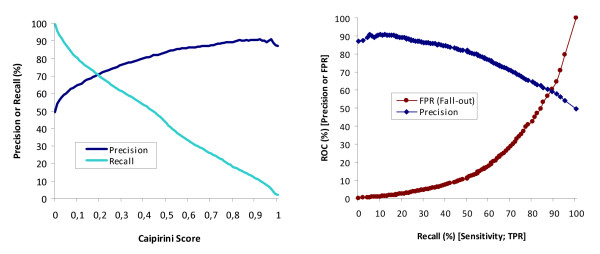
Figure 4.
Precision and recall values vs. Caipirini score for cell cycle dataset. For each abstract matching the query in input set C, Caipirini calculates a score, where a value of > 0.5 means the abstract is more likely similar to set A than set B (see Methods for details). The graph on the left shows the relationship between precision, recall, and Caipirini score for the benchmark dataset, where set A are genes related to S-phase of the cell-cycle and set B are cell-cycle genes not related to S-phase. These sets were used to rank a set of abstracts already known to be related either to S-phase or to all other cell-cycle phases. With these data Caipirini achieved a moderate recall value (43% at the default Caipirini score of 0.5), indicating that just less than half of all abstracts truly related to set A were retrieved. However Caipirini achieved a good precision: 84% of abstracts with a score of > 0.5 are true positives, and higher scores give increasingly better precision. The graph on the right shows the performance of Caipirini via the relationship between precision, recall, and false positive rate for the same dataset when the threshold is set at different Caipirini scores. Note that while Caipirini's threshold increases from left to right in the Precision vs. Recall representation (left), in the ROC representations (right) the opposite is implied and Caipirini's score increases with direction from right to left.

