
Fig. 3.
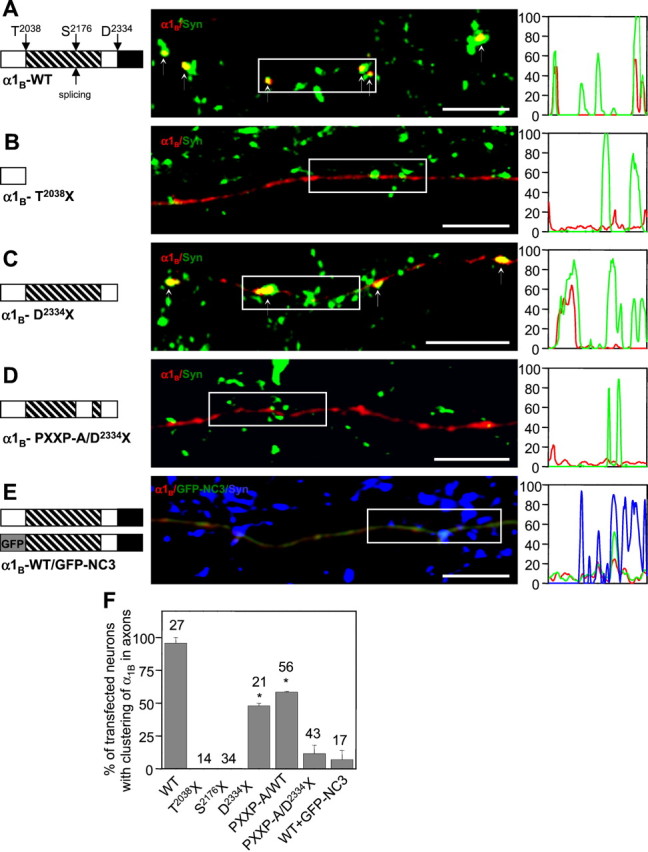
Structural determinants of recombinant N-type channel synaptic targeting. A–D, The wild-type (WT) HA-α1B subunit (A) and C-terminal mutants HA-α1B-T2038X (B), HA-α1B-D2334X (C), or HA-α1B-PXXP-A/D2334X (D) cotransfected with α2δ-1 and β3 subunits into high-density hippocampal neurons at 10 DIV. At 4 d after transfection, the axonal distribution of HA-α1B(red) and endogenous synapsin (green) was compared. The fluorescence intensity profiles of the boxed regions are shown on theright. In A and C, HA-α1B clusters are indicated by small arrows. The domain structure of the α1BC-terminal domain is shown on the left (proline-rich region, striped box; PDZ domain-binding motif,black box; PXXP-A mutation, gap instriped box). Scale bars, 10 μm. E, The recombinant N-type channels (HA-α1B/α2δ/β3) were cotransfected with GFP-NC3 construct (GFP fused to 2021–2339 aa of α1B) into high-density hippocampal neurons at 10 DIV. At 4 d after transfection, the localization of HA-α1B (red), GFP-NC3 (green), and endogenous synapsin (blue) was determined. The fluorescence intensity profiles of the boxed region for HA-α1B(red), GFP-NC3 (green), and synapsin (blue) are on the right. The domain structure of the HA-α1B and GFP-NC3 constructs is shown on the left. Scale bar, 10 μm.F, Quantitative analysis of HA-α1Bwild-type and C-terminal mutant axonal distribution. Based on visual examination, for each transfected neuron the axonal distribution of HA-α1B was scored as clustered or diffuse. The percentage of transfected neurons with clustered axonal distribution of HA-α1B was calculated for each transfection. The data from at least two independent transfections for each construct are presented as mean ± SD, with the total numbers of analyzed cells shown on the top. For D2334X and PXXP-A mutants, thep values (when compared with the wild type) are <0.002 and 0.01, respectively (indicated byasterisks).