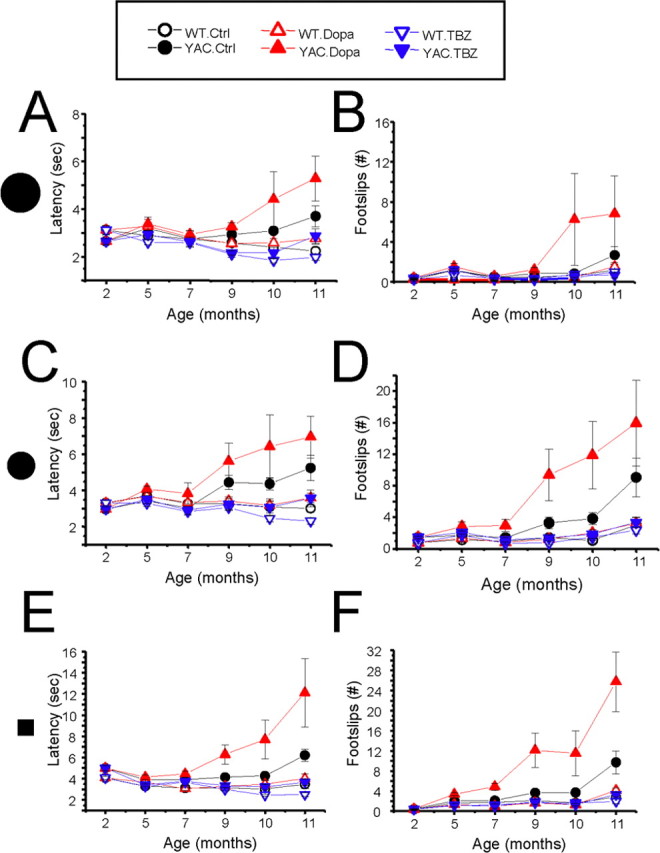
Figure 5.

Beam walk performance of YAC128 mice. The average time to cross the beam (A, C, E) and the average number of foot slips on the beam (B, D, F) are shown for beam walk experiments performed with 17 mm round beam (A, B), 11 mm round beam (C, D), and 5 mm square beam (E, F). The data for WT control (Ctrl) mice (open black circles), YAC128 (YAC) control mice (filled black circles), WT mice fed with l-DOPA (open red triangles), YAC128 mice fed with l-DOPA (filled red triangles), WT mice fed with l-DOPA/TBZ (WT. TBZ; open blue triangles), and YAC128 mice fed with l-DOPA/TBZ (YAC. TBZ; filled blue triangles) are shown as mean ± SEM (for the number of mice in each group, see Table 1) at 2, 5, 7, 9, 10, and 11 month (washout) time points.
