
Figure 6.
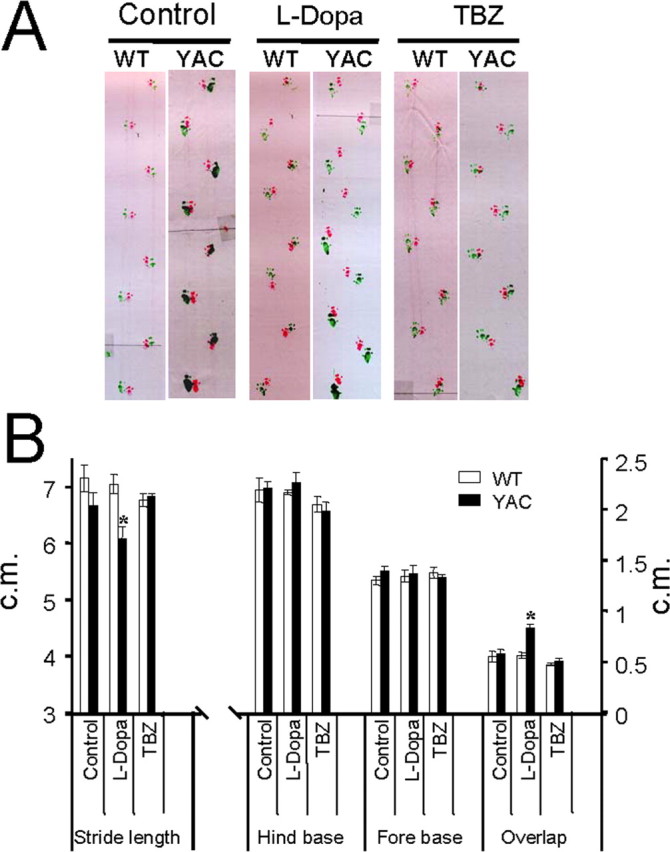
Gait analysis of YAC128 mice. A, The footprint patterns of 11-month-old YAC128 (YAC) and WT mice. The footprints for control, l-DOPA, and TBZ groups are shown for both WT and YAC128 mice. B, The footprint patterns were assessed quantitatively by four measurements: stride length, hindbase width, frontbase width, and front/hind footprint overlap. The hindbase and frontbase width measurements are similar for all six groups of mice. Feeding l-DOPA to YAC128 mice caused significantly shorter stride lengths and greater front/hind paw overlap than observed for control YAC128 mice. The YAC128 mice fed with l-DOPA/TBZ exhibited stride lengths and front/hind paw overlap similar to those from control WT and control YAC128 mice. Data for each measure are presented as mean ± SEM (for the number of mice in each group, see Table 1). *p < 0.05, significantly different from control YAC128 group.