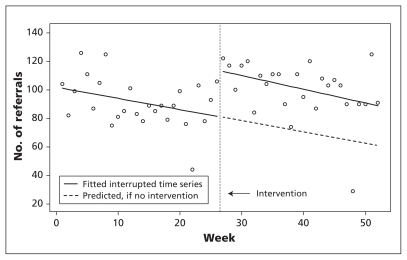
Figure 1:
Example of the calculation of the difference in the number of referrals to nephrologists before and after the intervention (the introduction of automatic reporting of the estimated glomerular filtration rate). The circles indicate the observed number of referrals. The difference in the number of referrals was calculated by subtracting the observed number after the intervention from the predicted number (dashed line) at biweekly intervals.

