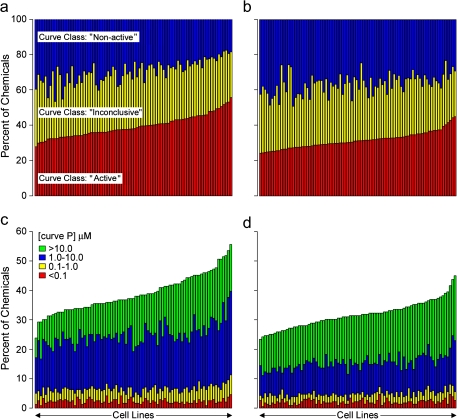
FIG. 2.
Distribution of cytotoxicity across chemicals for cytotoxicity (panels a and c) and caspase-3/7 (panels b and d) assays. Panels a and b give the percentage of chemicals classified as “active,” “nonactive,” or “inconclusive” for each cell line. Panels c and d give the range of potency (curve P) for active chemicals in each cell line.

