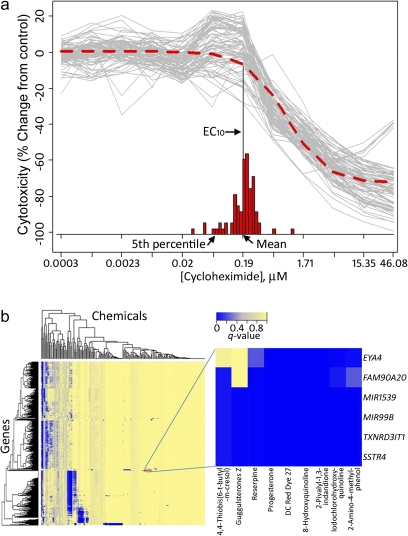
FIG. 6.
Panel a, a population concentration response was modeled using in vitro qHTS data using cycloheximide data (cytotoxicity assay) as an example. Logistic dose-response modeling was performed for each individual to the values shown in gray, providing individual 10% effect concentration values (EC10). The EC10 obtained by performing the modeling on average assay values for each concentration (see frequency distribution) are shown in the inset. Panel b, a heatmap of clustered FDRs (q values, see color bar) for association of the data from caspase-3/7 assay with publicly available RNA-Seq expression data on a subset of cell lines. A sample subcluster is shown.

