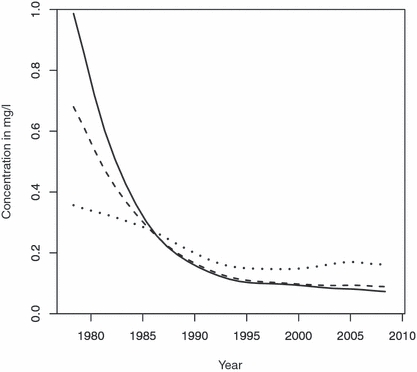
FIGURE 6.

Estimated Concentration of Total Phosphorus, Patuxent River Near Bowie, Maryland, Evaluated at May 1 of Each Year for Discharge Values of 5 (solid), 9 (dashed), and 30 (dotted) m3/s. Note the crossover of the curves around 1986. Prior to that time, concentration tended to fall with increasing discharge. After that time, concentration rose with increasing discharge.
