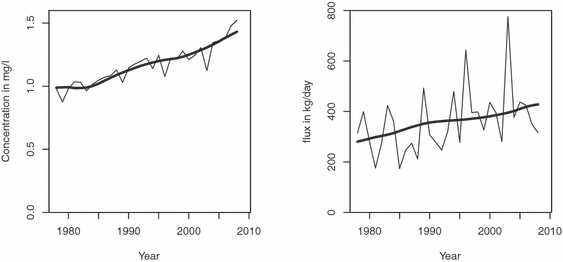
FIGURE 13.

The Left Panel Is the Annual Average Estimated Dissolved Nitrate Plus Nitrite Concentration (light line) and the Flow-Normalized Annual Average Estimate (heavy line), for the Choptank Rver Near Greensboro, Maryland. The right panel contains flux estimates. In both cases, the annual estimates (light line) are the same as those plotted as the heavy line in the two panels of Figure 12.
