FIGURE 15.

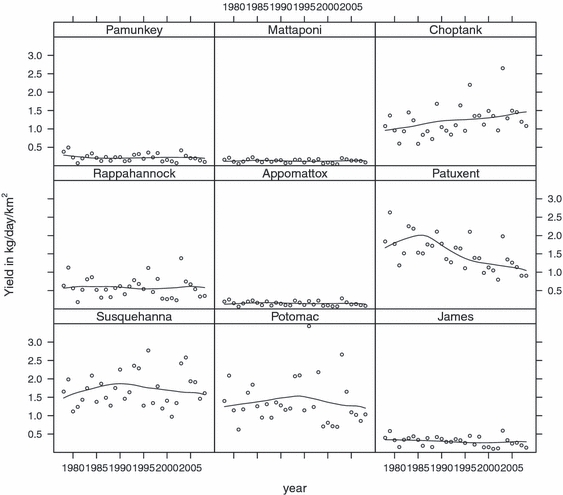
Dissolved Nitrate Plus Nitrite Yields for the Nine River Input Monitoring Sites Using WRTDS Method. Circles are the average annual estimates. The line represents the flow-normalized annual estimates.

Dissolved Nitrate Plus Nitrite Yields for the Nine River Input Monitoring Sites Using WRTDS Method. Circles are the average annual estimates. The line represents the flow-normalized annual estimates.