
FIGURE 5.
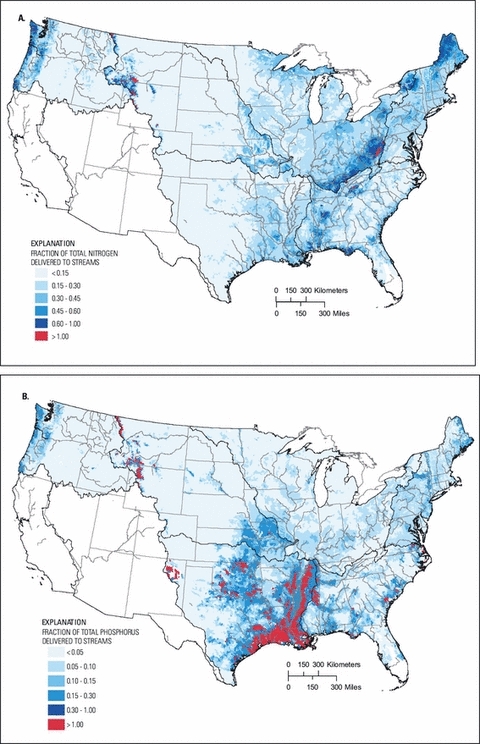
Fraction of (A) Total Nitrogen and (B) Total Phosphorus Delivered With Transport From the Land Surface to Stream Reaches.
Official websites use .gov
A
.gov website belongs to an official
government organization in the United States.
Secure .gov websites use HTTPS
A lock (
) or https:// means you've safely
connected to the .gov website. Share sensitive
information only on official, secure websites.
Fraction of (A) Total Nitrogen and (B) Total Phosphorus Delivered With Transport From the Land Surface to Stream Reaches.