FIGURE 7.

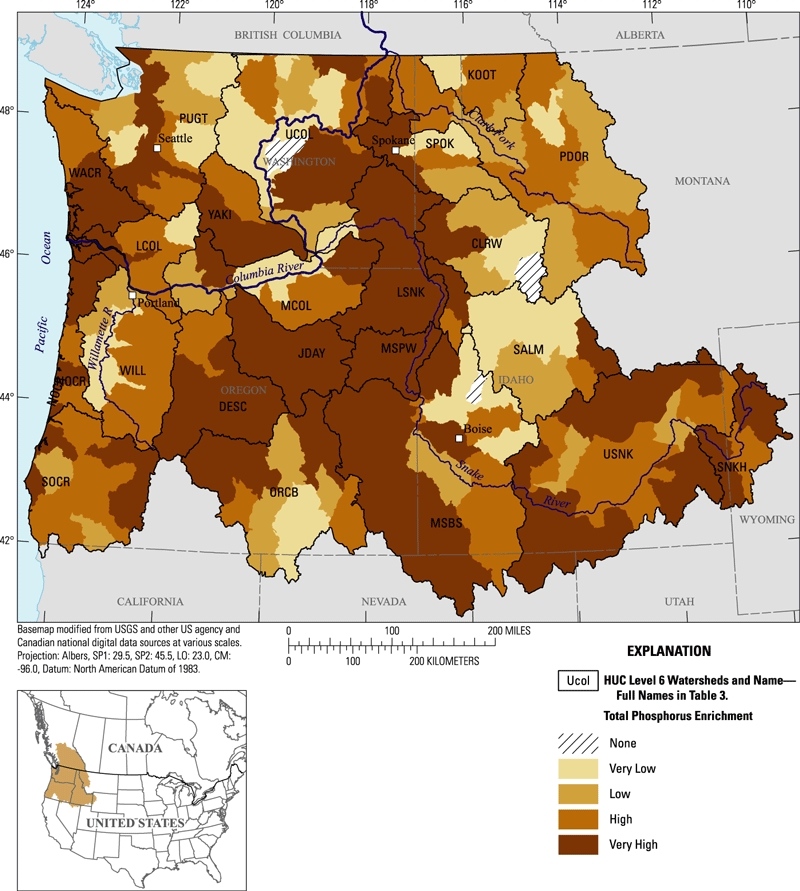
Estimated Total Phosphorus Enrichment for the United States Pacific Northwest (2002 conditions). Results are shown for each HUC8 watershed.

Estimated Total Phosphorus Enrichment for the United States Pacific Northwest (2002 conditions). Results are shown for each HUC8 watershed.