FIGURE 3.

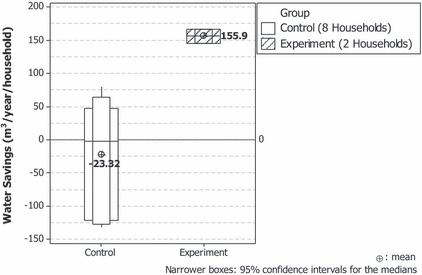
Comparison of the Annual Outdoor Water Savings Between the Control and Experimental Groups Among the 90th Percentile of “Pre” Period (2001 to 2004) Water Users (annual use >261.6 m3).

Comparison of the Annual Outdoor Water Savings Between the Control and Experimental Groups Among the 90th Percentile of “Pre” Period (2001 to 2004) Water Users (annual use >261.6 m3).