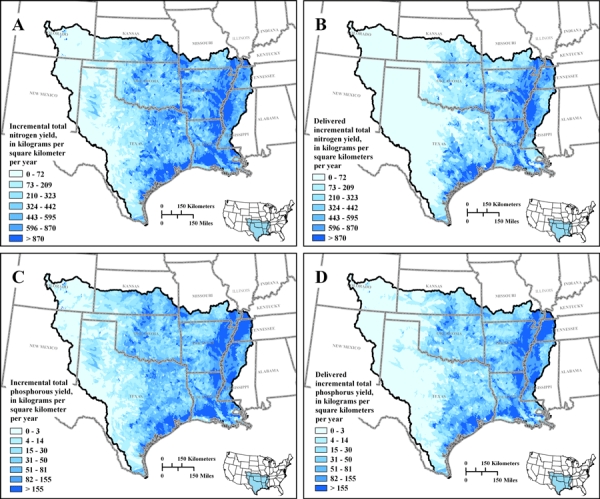
FIGURE 3.

(A) Incremental Total Nitrogen Yield, (B) Delivered Incremental Total Nitrogen Yield, (C) Incremental Total Phosphorus Yield, and (D) Delivered Incremental Total Phosphorus Yield for the Lower Mississippi Texas-Gulf Region. Incremental yields are those generated for individual catchments, and delivered incremental yields are the portion of incremental yields that are delivered to downstream target areas, in this case, to terminal reaches along the Louisiana and Texas coasts.
