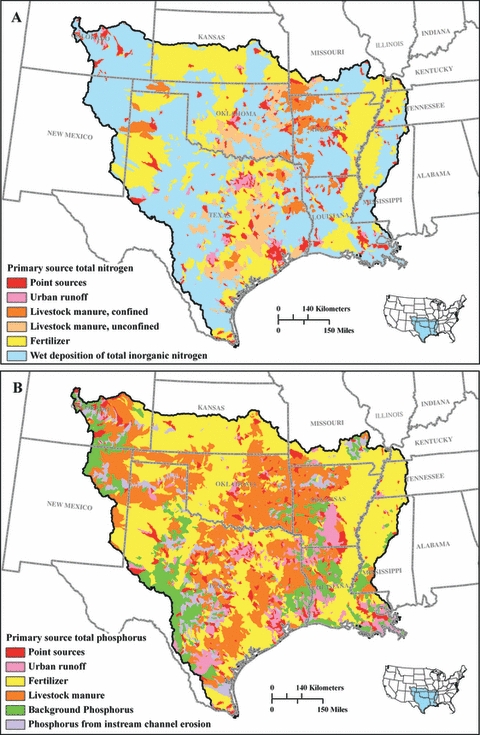
FIGURE 4.

Primary Sources of (A) Total Nitrogen and (B) Total Phosphorus as a Percentage of Incremental Catchment Loads in the Lower Mississippi Texas-Gulf Region.

Primary Sources of (A) Total Nitrogen and (B) Total Phosphorus as a Percentage of Incremental Catchment Loads in the Lower Mississippi Texas-Gulf Region.