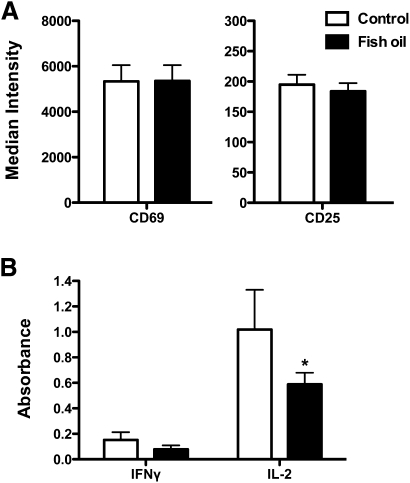
Fig. 7.
FO suppressed B-cell stimulated IL-2 secretion from naive CD4+ T cells. A: Median fluorescence intensity of CD4+ T cells stained with anti-CD69 and anti-CD25 after 24 h. CD4+ T cells were stimulated with B cells isolated from mice fed a control or FO diet. B: Cytokine secretion after 24 h of activation. Values are means ± SEM (n = 6). Asterisk indicates different from control: *P < 0.05.

