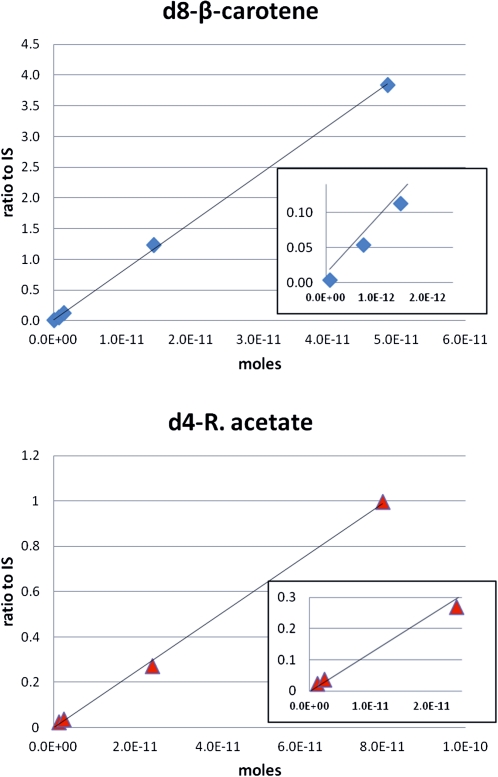
Fig. 2.
HPLC-MS standard curves for d8-β-carotene (m/z 543.5 + 544.5; top) and d4-retinyl acetate (273 > 94,217; bottom). Insets show linearity of curves at the lowest three concentrations used. The y axis represents the ratio of peak area of the analyte to the internal standard. Amounts of internal standards added were 2.6 × 10⁻¹¹ moles of 13C-β-carotene for the d8-β-carotene analysis and 7.3 × 10⁻¹¹ moles of 12C- retinyl acetate for the d4-retinyl acetate analysis.

