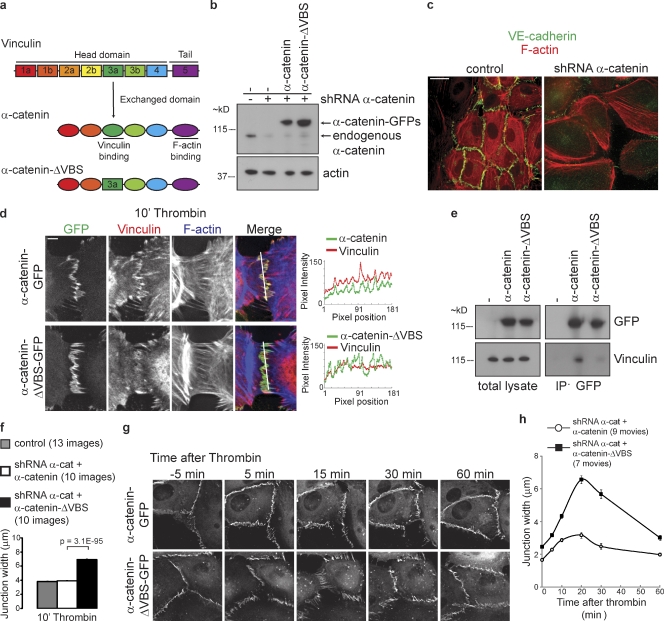
Figure 6.
Junctional Vinculin restrains force-dependent junction disruption by thrombin. (a) Schematic representation of Vinculin and α-catenin to illustrate which homolog’s domain (dark green) was swapped to generate a hybrid α-catenin–ΔVBS that is unable to associate with Vinculin. (b) Representative Western blot analysis of α-catenin and actin in lysates of HUVECs transduced with α-catenin shRNAs and rescued by α-catenin–GFP or α-catenin–ΔVBS–GFP. (c) IF images of control HUVECs and HUVECs transduced with lentiviral shRNA against human α-catenin stained for VE-cadherin (green) and F-actin (red). Bar, 20 µm. (d) IF images of α-catenin shRNA-transduced HUVECs rescued with wild-type α-catenin–GFP (top) or α-catenin–ΔVBS–GFP (bottom) that were stimulated with thrombin for 10 min, and stained for Vinculin (red) and F-actin (blue). Colocalization of Vinculin with α-catenin–GFP or α-catenin–ΔVBS–GFP was analyzed by line scans displaying signal intensity across the FAJs as indicated. Bar, 10 µm. (e) Representative Western blot analysis of GFP and Vinculin in total lysates and in GFP immunoprecipitations from thrombin-stimulated HUVECs expressing indicated GFP constructs. (f) Quantification of the average junction width ± SEM after 10 min of thrombin treatment as measured using ImageJ in IF stainings of two independent experiments of control HUVECs (13 images, n = 382 junction width measurements), α-catenin shRNA–transduced HUVECs rescued with α-catenin–GFP (10 images, n = 987), or α-catenin–ΔVBS–GFP (10 images, n = 1,201). P-value was calculated with a two-tailed, homoscedastic Student’s t test. (g) Time-lapse images of α-catenin shRNA transduced HUVECs rescued with α-catenin–GFP (top) or α-catenin–ΔVBS–GFP (bottom) that were stimulated with thrombin, showing that thrombin induces wider remodeling junctions that persist longer in α-catenin–ΔVBS–GFP cells than in α-catenin–GFP cells. See corresponding Video 10 for ∼3-h time-lapse recordings. Bar, 10 µm. (h) Quantification of the mean junction width ± SEM after thrombin of α-catenin–GFP (nine time-lapse recordings) and α-catenin–ΔVBS–GFP (seven time-lapse recordings) junctions of two independent experiments as measured in time-lapse recordings using ImageJ. The number of junction width measurements (n value) of α-catenin–GFP and α-catenin–ΔVBS–GFP at time points 0, 10, 15, 20, 30, and 60 min after thrombin were 208, 409; 212, 375; 143, 311; 67, 180; 69, 126; and 149, 230, respectively.

