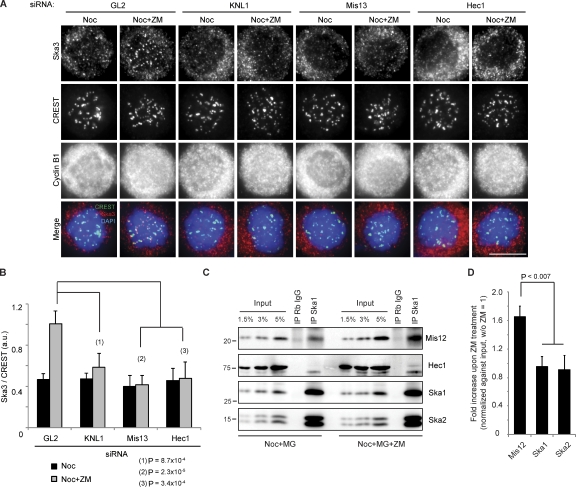
Figure 2.
Aurora B regulates the interaction between Ska and KMN. (A) HeLa S3 cells were treated for 48 h with GL2, KNL1, or Hec1 siRNAs or for 72 h with Mis13 siRNA before treatment with 3.3 µM nocodazole (Noc) for 1 h and a 2-h incubation with DMSO or ZM. Bar, 10 µm. (B) A bar graph showing the quantification of Ska3 staining intensity, as in Fig. 1 E, of cells treated as in A (>100 KTs from five cells; SD of five cells). (C) 0.33 µM nocodazole-arrested mitotic cells was treated with MG132 or MG132 plus ZM. After 2 h, cells were collected, and immunoprecipitations (IP) were performed with either rabbit IgGs (Rb IgG; as a control) or anti-Ska1 antibodies. Molecular mass is indicated in kilodaltons. (D) A bar graph showing the quantification of the intensities of coprecipitated proteins upon ZM treatment (relative to treatment without ZM; SD of three independent experiments).

