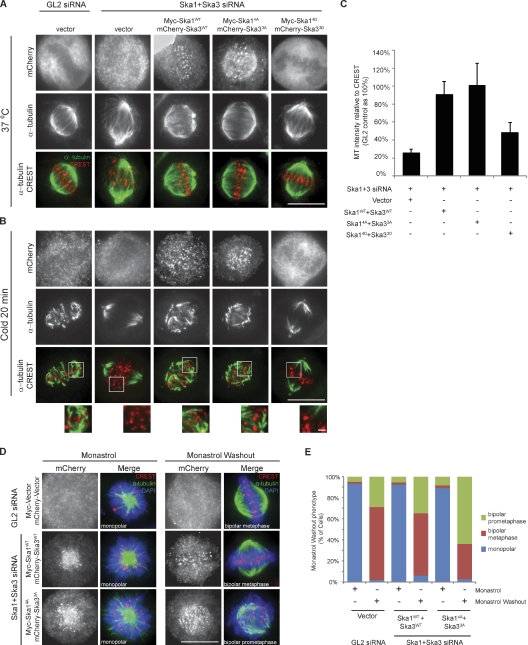
Figure 5.
Aurora B phosphorylation of Ska proteins regulates K-fiber stability. (A and B) HeLa S3 cells were treated as in Fig. 4 B. Cells were left at 37°C (A) or placed at 4°C (B) for 20 min before being stained. (insets) Magnifications of a few KTs for each condition. (C) A bar graph showing the quantification of α-tubulin staining intensity around KTs (normalized against CREST) of cells treated as in B (>12 cells, >25 KTs per cell; SD of three independent experiments). (D) Cells were treated as in Fig. 4 B except that monastrol was added after the second thymidine release. After 10 h, cells were either fixed or washed and released into fresh medium containing MG132 for 1 h before fixation. (E) A bar graph showing the quantification of cells with monopolar/bipolar spindles (>60 cells per condition, ≥20 cells in three independent experiments). Bars: (A, B, and D) 10 µm; (B, insets) 1 µm.

