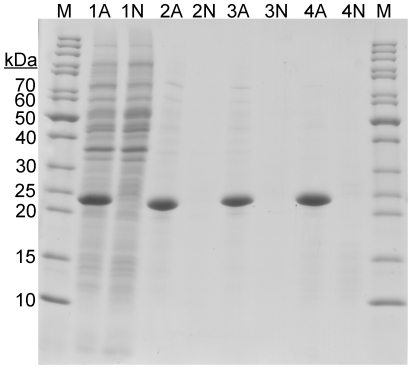
Figure 1. SDS-PAGE analysis of samples from different stages of purification of recombinant amelogenin from E. coli cells.
Lanes marked with (A) represent samples from cells expressing amelogenin and lanes marked with (N) refers to negative control cells harboring empty expression vector. Lanes marked with (1) represent whole cell samples after cultivation. Lanes marked (2), (3) and (4) represent samples after different treatments of the intact cells. (2): soluble fractions of cells sonication in 3% HAc. (3): soluble fractions after heat treatment of the sonicated samples in lanes 2A and 2N. (4): soluble fractions of cells directly heat treated at 80°C. This generates the most pure amelogenin. Lanes marked (M) contain molecular weight markers.

