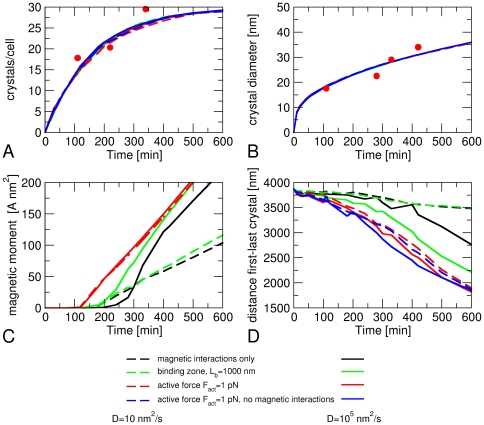
Figure 2. Simulated dynamics of magnetosome formation.
(A) number of crystals per cell, (B) average crystal diameter, (C) average magnetic moment of a cell, and (D) average distance d l-r between the leftmost and rightmost magnetosome as functions of time after the induction of magnetosome formation. The colors of the curves indicate the interactions and transport mechanisms included in the simulations, solid lines are for high magnetosome mobility (D = 0.01 mm2/s), dashed lines for low mobility (D = 10 nm2/s). The experimental data points are from Refs. [18] (A) and [20] (B).

