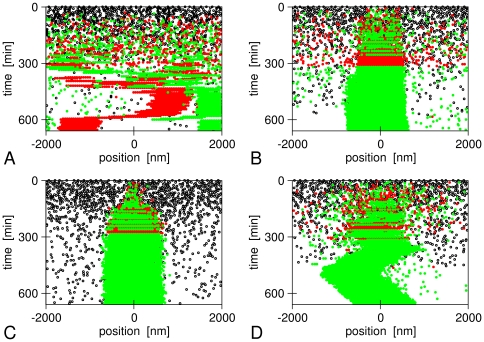
Figure 3. Example time traces of magnetosome formation in our simulations.
(A) Magnetic interactions and diffusion only, (B) binding zone in the cell center (L b = 1000 nm), (C) and (D) active transport to the cell center with an active force F act = 1 pN (C) and 0.01 pN (D). In all panels, black dots indicate empty magnetosome vesicles, green and red points indicate magnetosomes containing a crystal with plus or minus orientation of its magnetic moment. In all panels, the magnetosome mobility is given by D = 105 nm2/s.

