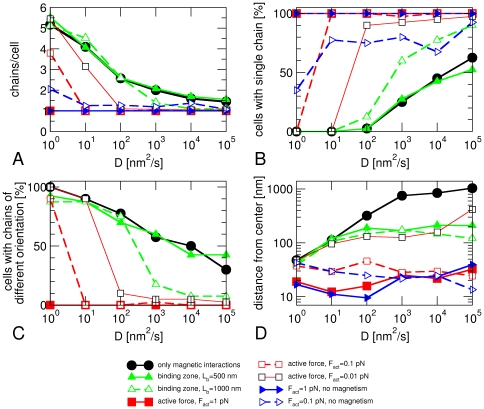
Figure 4. Analysis of the structures formed after 10 hours for different scenarios of magnetosome formation.
(A) average number of chains per cell, (B) fraction of cell with a single chain, (C) fraction of cells with chains that have opposite orientations of their magnetic moment, (D) average distance of the center of mass of the magnetosomes from the cell center, plotted as functions of the magnetosome mobility, which is characterized by the diffusion coefficient D. For each scenario and each value of D, 40 cells were simulated and analyzed.

