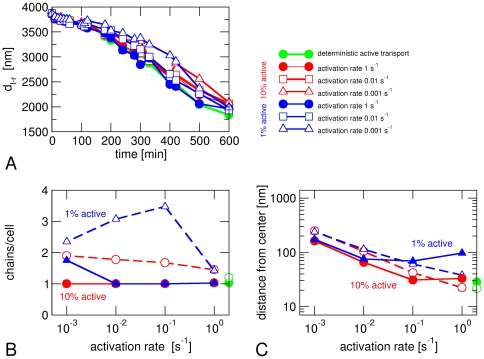
Figure 5. Stochastic active transport.
Data from simulations where active transport of a magnetosomes is switched on and off stochastically. Transport is on during 10% (red) or 1% of the time (blue) with different activation rates. (A) Time evolution of the distance d l-r between the leftmost and rightmost magnetosome. (B) Average number of chains per cell and (C) distance of the magnetosome center of mass from the cell center after 10 hours. Green circles indicate the results for active transport that is constitutively on. Open symbols indicate the corresponding results in the absence of magnetic interactions. All data shown here are from simulations with D = 1000 nm2/s and an average active force of 0.1 pN.

