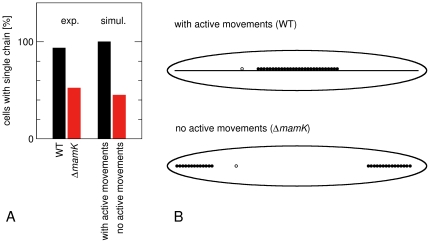
Figure 7. Comparison of chain formation in simulations and experiments.
(A) Fractions of cells with a single chain as observed from electron microscopy images of M. gryphiswaldense wild type and ΔmamK cells [15] and from our simulations with and without active movements of magnetosomes (data from Fig. 4B, with D = 104 nm2/s and F act = 0.1 pN). (B) Examples of magnetosome structures formed in these simulations. These structures are very similar to those seen in electron microscopy images of Ref. [15].

