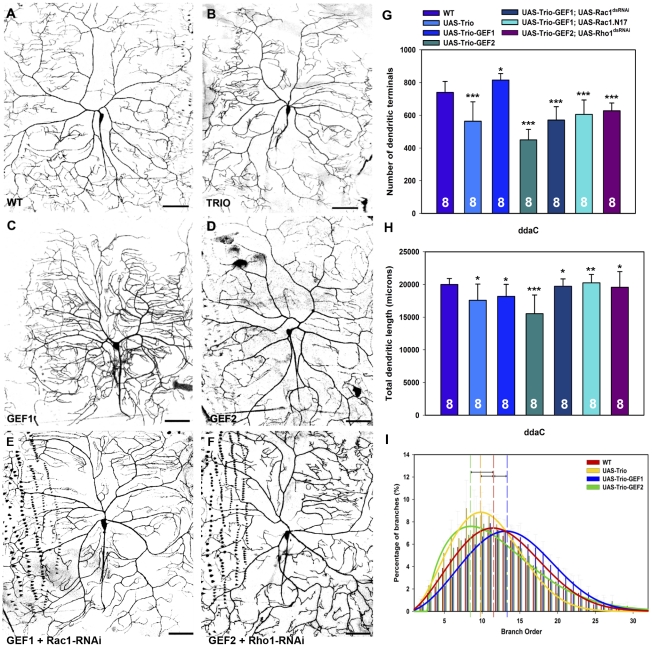
Figure 5. Trio overexpression in class IV da neurons.
(A–F) Live confocal images of third instar larval dorsal ddaC class IV da neurons labeled with GAL4477,UAS-mCD8::GFP. As compared to control (A), Trio overexpression results in decreased dendritic branching (B). (C) In contrast, Trio-GEF1 overexpression leads to an increase in dendritic branching, whereas Trio-GEF2 overexpression results in a reduction in dendritic branching (D). (E) RNAi knockdown of Rac1 in a Trio-GEF1 overexpression background suppresses defects in dendritic development as compared to Trio-GEF1 overexpression alone. (F) RNAi knockdown of Rho1 in a Trio-GEF2 overexpression background suppresses defects in dendrite morphogenesis as compared to Trio-GEF2 overexpression alone. (G) Analyses of the number of dendritic terminals reveals a decrease in dendritic branching with Trio and Trio-GEF2 overexpression whereas Trio-GEF1 overexpression leads to an increase in dendritic branching relative to wild-type controls. Knockdown of Rac1 via RNAi or by co-expression of the dominant negative Rac1.N17 suppresses defects in dendritic branching relative to Trio-GEF1 overexpression alone, whereas knockdown of Rho1 via RNAi suppresses defects in branching as compared to Trio-GEF2 overexpression alone. (H) Quantitation of total dendritic length reveals a mild to moderate reduction with Trio, Trio-GEF1 and Trio-GEF2 overexpression as compared to wild-type controls. Consistent with dendritic branching, disrupting Rac1 or Rho1 function suppresses defects in dendritic length as compared to Trio-GEF1 or Trio-GEF2 overexpression, respectively. (I) Relative to control (n = 6), dendritic branch order analyses reveal a proximal shift in the percentage of lower order branching with Trio (n = 8) and Trio-GEF2 (n = 8) overexpression, whereas Trio-GEF1 (n = 8) overexpression results in a distal shift towards higher order branching in class IV ddaC neurons. Images were taken at 20× magnification and size bar represents 50 microns. The total n value for each neuron and genotype quantified is reported on the bar graph. Statistically significant p values are reported on the graphs as follows (* = p<0.05; ** = p<0.01; *** = p<0.001). Genotypes: WT: GAL4477,UAS-mCD8::GFP/+. TRIO: UAS-trio/+;GAL4477,UAS-mCD8::GFP/+. GEF1: UAS-trio-GEF1-myc/GAL4477,UAS-mCD8::GFP. GEF2: GAL4477,UAS-mCD8::GFP/+;UAS-trio-GEF2-myc/+. GEF1+Rac1-RNAi: UAS-trio-GEF1-myc/GAL4477,UAS-mCD8::GFP;UAS-Rac1JF02813/+. GEF1+Rac1.N17: UAS-trio-GEF1-myc/GAL4477,UAS-mCD8::GFP;UAS-Rac1.N17/+ GEF2+Rho1-RNAi: GAL4477,UAS-mCD8::GFP/+;UAS-trio-GEF2-myc/UAS-Rho1-dsRNA.

