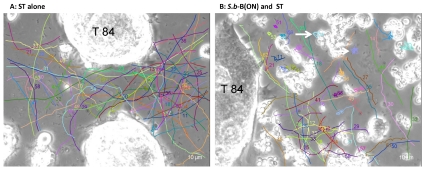
Figure 1. Swimming trajectories of ST incubated alone with T84 cells (A) or cells incubated overnight (ON) with S.b-B and exposed to ST (B) derived from a sequence using MTrack J processing software.
Records were performed 60 min post infection (PI), and the time between consecutive images was 0.1 second. Using MTrackJ software we determined the locations for each bacterium, and this information was then translated into coordinates (x,y) for each bacterial cell and the process was repeated in times series. The 2D trajectories of each bacterial cell were represented; different colours represent different trajectories. Each trajectory has it own number. Arrows in panel B indicate “rotating” ST trajectories.

