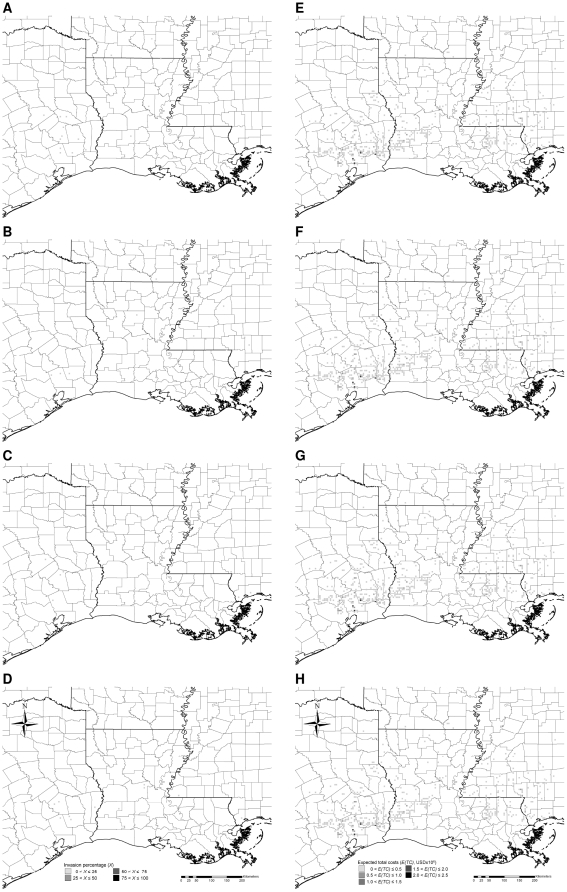
Figure 6. Typical simulated patterns of Chinese tallow invasion with high intensity control (A–D) and associated expected total costs (E–H) accumulated to the 5th, 10th, 15th, and 20th year, respectively.
Simulations were initialized with the observed pattern of Chinese tallow invasion in the year 2003 based on the nonnative invasive plant dataset [53] (see Fig. 2A). Each time series of patterns is based on one randomly-chosen stochastic simulation.

