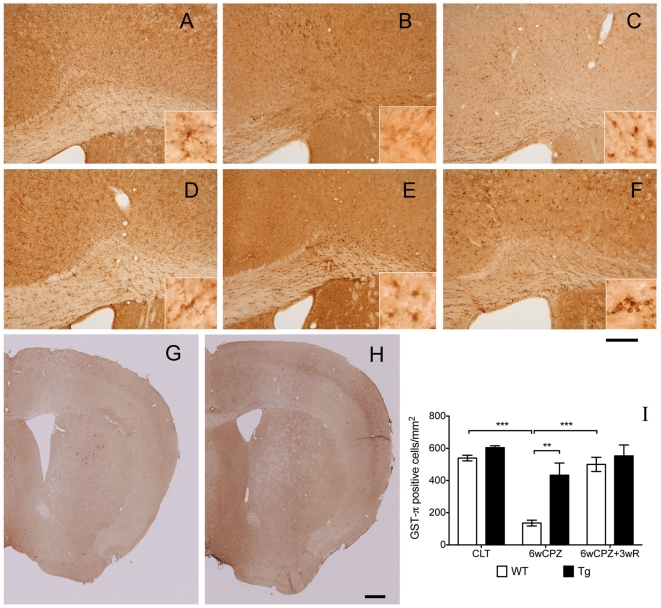
Figure 3. Increased levels of galanin attenuated CPZ-induced oligodendrocyte loss.
Mature oligodendrocytes were detected with IHC using a GST-π antibody. Photographs (A–F) were taken from the knee region of the CC, and (G) and (H) are examples of the full-size pictures taken of WT and Tg brains from the 6wCPZ group. The three CC images in the upper panels (A–C) show the WT mice from the CTL, 6wCPZ and 6wCPZ+3wR groups, and the three images in the middle panels (D–F) show the Tg mice from the same groups. In (A–F), high-magnification micrographs were also taken of the CC area using an oil-immersion lens, as shown in the inserts. (I) A bar chart displaying the numbers of GST-π positive cells, which were counted manually. **p<0.01, ***p<0.001, n = 3 in each group. The longer scale bar represents a length of 200 µm and the shorte scale bar represents 500 µm.

