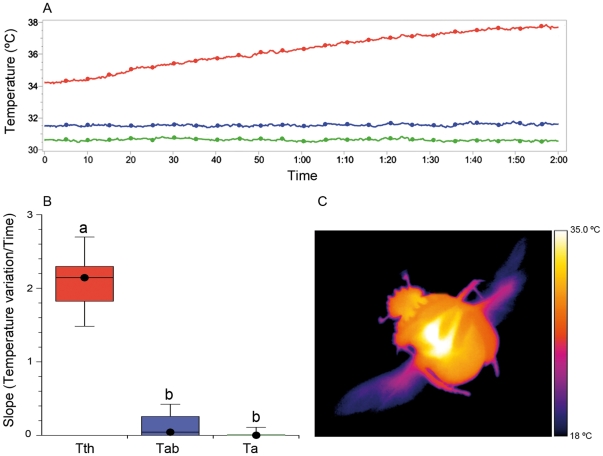
Figure 2. Flight thermoregulatory behaviour of Scarabaeus sacer.
(A) Individual variation of Tthorax (in red) and Tabdomen (in blue). Environmental temperature (Tambient) (in green) was maintained during each experiment. (B) Comparison of slopes of Tthorax, Tabdomen and Tambient variation during flight (N = 27; Kruskal-Wallis test with the Conover-Inman post hoc test for pairwise comparisons, α<0.05); black dots indicate the median values; temperatures with the same letter did not differ significantly from each other. (C) Thermal image of S. sacer during flight showing the strong contrast between Tthorax and Tabdomen.

