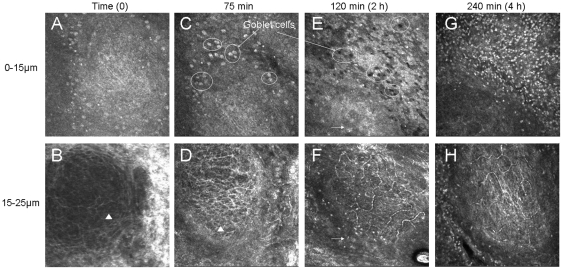
Figure 2. IVCM analysis of rabbit CALT, 75 min (A, B), 2 h (C, D) and 4 h (E, F) after the first instillation of 0.02%BAK+latanoprost in dome layers (A, C, E: 0–15 µm) and in intrafollicular layers (B, D, F: 15–30 µm).
All images: 400 µm×400 µm. Note the disappearance of goblet cells around the CALT structure with the increase of inflammatory cell infiltration in dome layers and the activation of lymphatic vessels with the increase of inflammatory cell infiltration in the intrafollicular layers.

