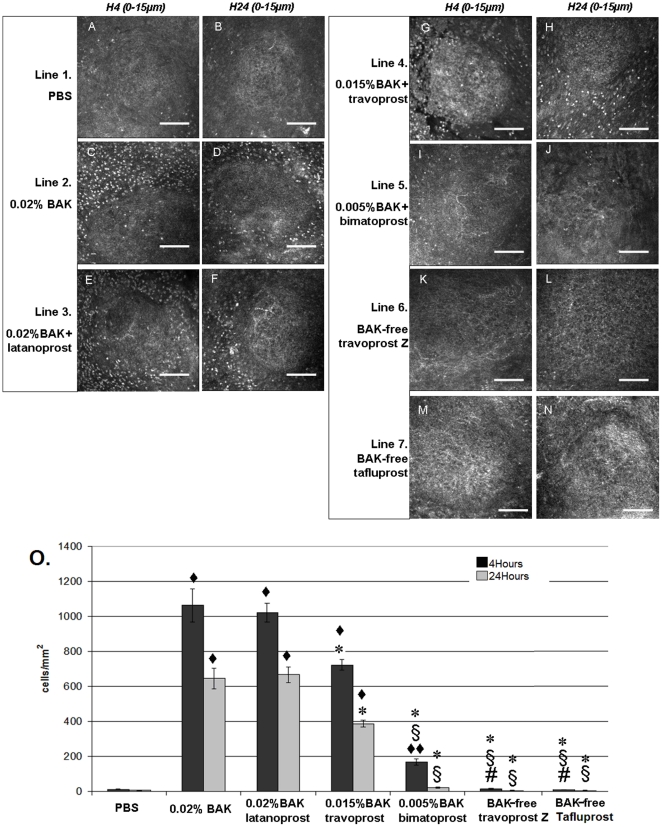
Figure 3. IVCM analysis in rabbit CALT dome layers (0–15 µm) after 15 instillations of PBS (A, B), 0.02%BAK (C, D), 0.02%BAK+latanoprost (E, F), 0.015%BAK+travoprost (G, H), 0.005%BAK+bimatoprost (I–J), BAK-freetravoprost (K, L) or BAK-freetafluprost (M, N) at 4 h (A, C, E, G, I, K, M) and at 24 h (B, D, F, H, J, L, N).
Note the hyperreflective patterns of inflammatory cells, especially after the application of 0.02BAK%, 0.02%BAK+latanoprost and 0.015%BAK+travoprost (IVCM images: bar, 100 µm). The inflammatory cells were counted using Cell Count software attached to the IVCM (O). ♦ P<0.0001 compared to PBS and ♦♦ P<0.03 compared to PBS; * P<0.0001 compared to 0.02%BAK+latanoprost and 0.02%BAK groups; § P<0.0001 compared to 0.015%BAK+travoprost group; # P<0.03 compared to 0.005%BAK+bimatoprost group.

