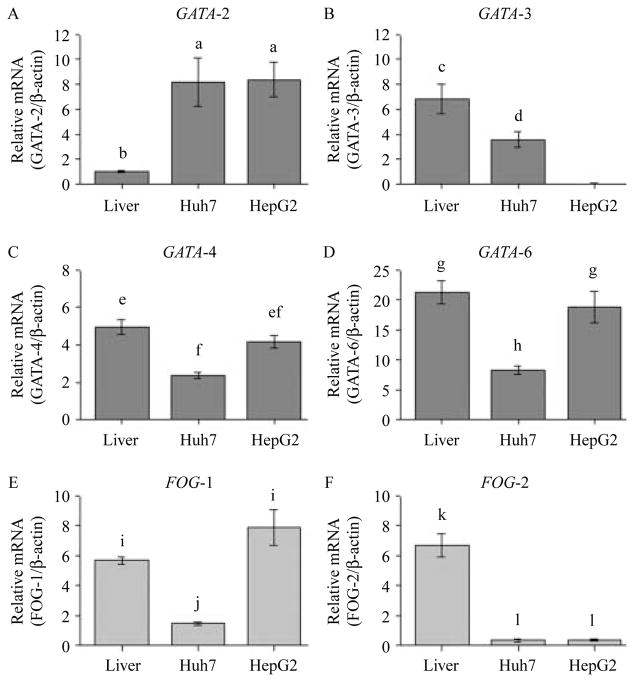
Figure 6.
The expression of GATA (2, 3, 4, and 6; panels A–D) and FOG (1 and 2; panels E and F) in the human liver and hepatoma cell lines. Total RNA from hepatocytes was isolated using TRizol (Invitrogen Canada). An aliquot of the total RNA (2 μg) was used as a template to synthesize the first-strand cDNA using the Omniscript reverse transcriptase-PCR system (Qiagen), 5 μl of diluted cDNA (1:6) was then used as a template in the RT-PCRs. Quantification of gene expression was performed by a Rotor Gene 3000 Real-time DNA Detection System (Montreal Biotech, Kirkland, QC, Canada) with QuantiTect SYBRGreen I PCR kits (Qiagen). Amplifications were performed in duplicate using at least three different preparations of first-strand cDNAs for each of the three different RNA extractions while adult human liver total RNA was purchased from Clontech Laboratories, Inc. Expression levels for GATA (dark gray bars) and FOG (light gray bars) were normalized to the housekeeping gene β-actin. The results are presented as mean (±S.E.M.) of the relative mRNA expression. A different superscript indicates a statistically significant difference between means (a–lP<0·05).

