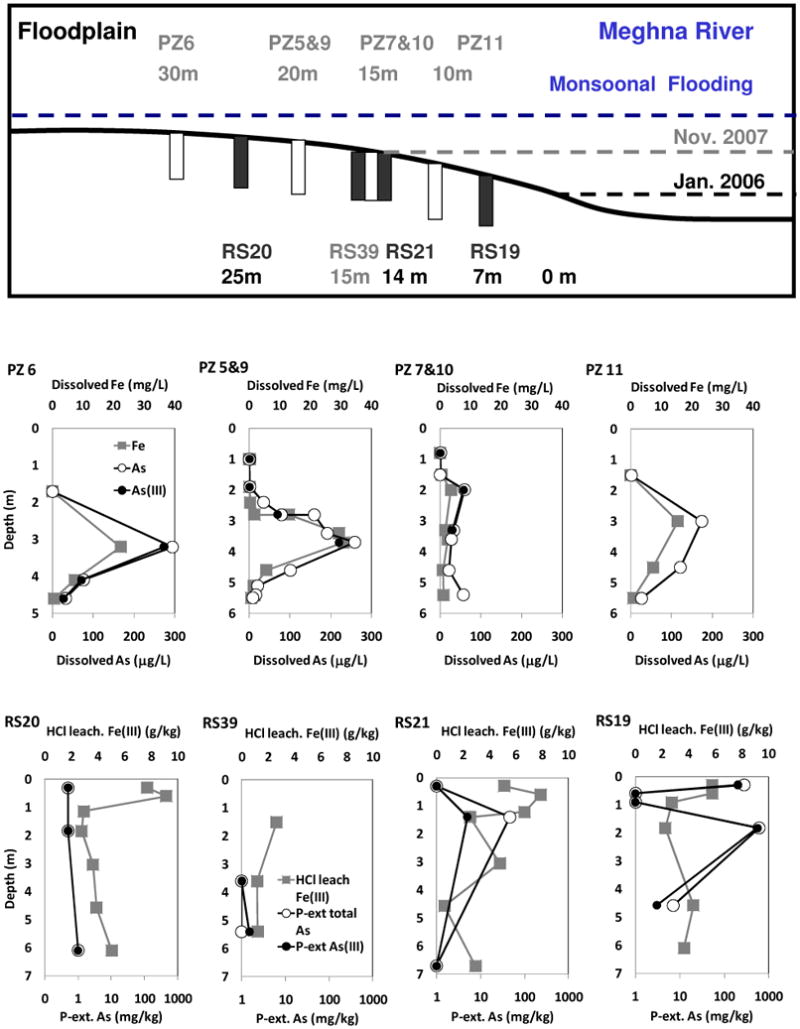
Fig. 1.

Top: Schematic diagram showing the location of porewater and sediment core sampling collected in Jan. 2006 (black font) and Nov. 2007 (gray font) with the distance from the river shore in Jan. 2006. Open bars and solid bars indicate porewater piezometers and sediment cores, respectively; Middle: Depth profiles of porewater dissolved Fe, As, and As(III) concentrations; Bottom: Depth profiles of sediment HCl leachable Fe(III) and P-extractable total As and As(III) concentrations.
