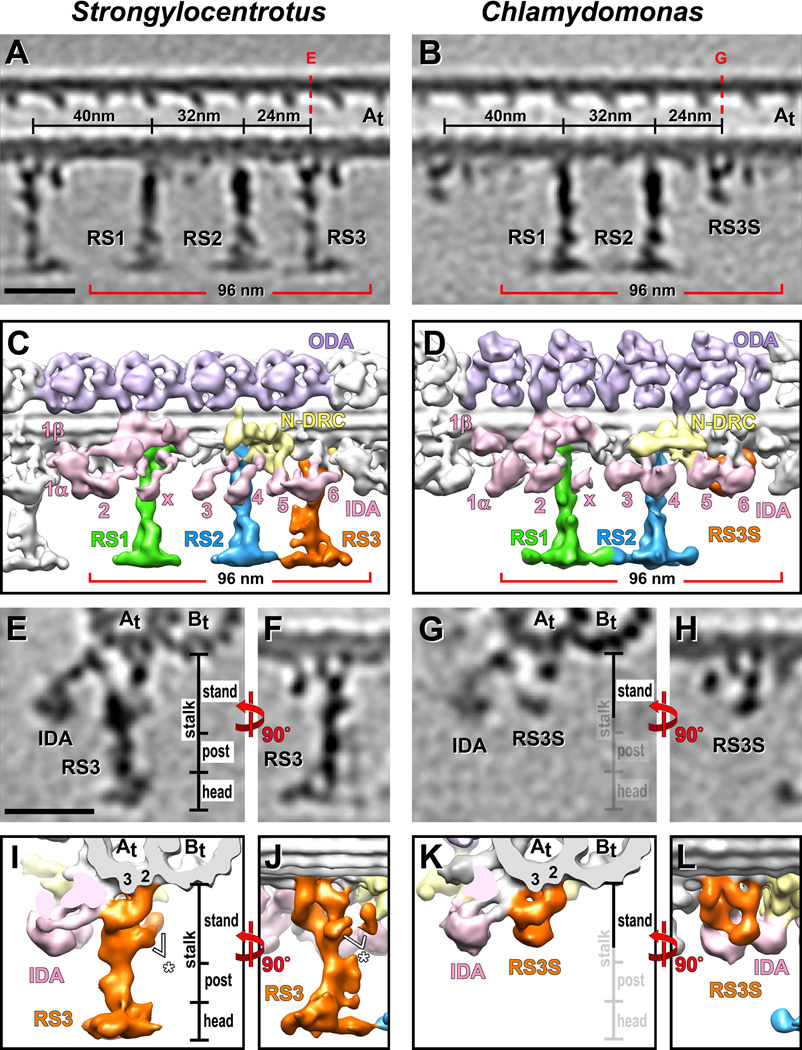
Figure 4. Comparison of the Strongylocentrotus RS triplet and Chlamydomonas RS pair with special emphasis on RS3 and RS3S.
(A–L) Tomographic slices (A, B and E–H) and isosurface renderings (C, D and I–L) from averaged axonemal repeats of Strongylocentrotus (sea urchin) (A, C, E, F, I and J) and Chlamydomonas (algae) (B, D, G, H, K and L), viewed from the front (A–D), back (F, H, J and L) and in cross-section from distal (E, G, I and K), show that the structure of RS3S in Chlamydomonas closely resembles the RS3 stand in Strongylocentrotus. Red dotted lines in (A and B) indicate the locations of the tomographic slices shown in (E and G). The white asterisks in (I and J) highlight parts of the RSJ structure that is attached to the back of RS3. The post and head region of RS3, as well as the RSJ structure are not present in Chlamydomonas. The labels for these regions are faded in (G and K) for easier comparison. Panels A and C are the same as Figure 1A and 1B, and panel D is reproduced from Barber et al. [2011] Figure 3A with minor modifications. Scale bars are 25 nm (scale bar in A valid for B; scale bar in E valid for F–H).

