FIGURE 5.
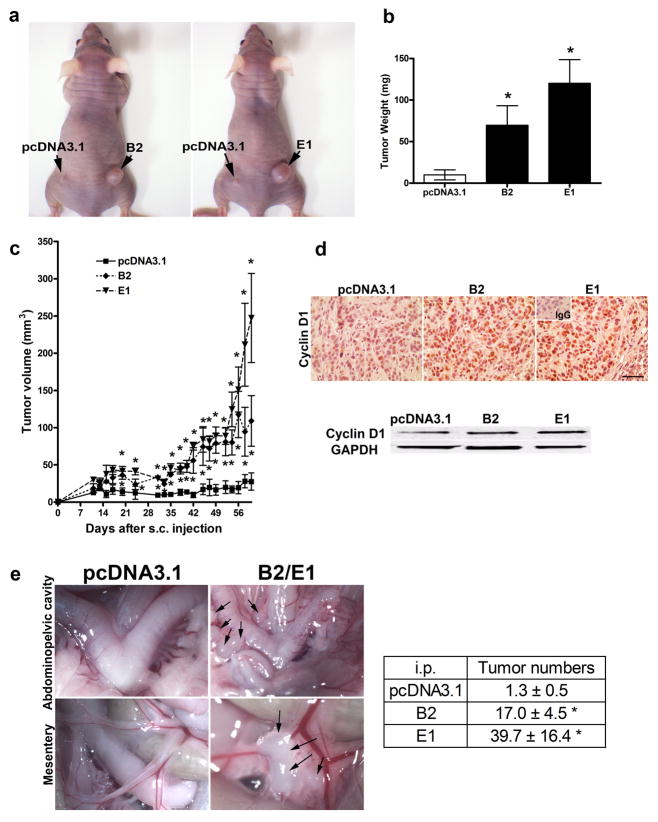
WNT7A overexpression increases tumor growth. (ab) In vivo xenograft tumor growth. Nude mice were injected s.c. with vector control or WNT7A overexpressing cells (B2 or E1). Final tumor pictures (a) and tumor weight (b) 9 weeks after s.c. injection are shown. * vs pcDNA3.1 vector control, P<0.05. (c) Tumor volume was measured every 2 days 10 days after s.c. injection. * vs pcDNA3.1 vector control, P<0.05. (d) Cyclin D1 expression in s.c. tumors that developed from pcDNA3.1 vector control and WNT7A overexpressed cells was determined by immunohistochemistry and western blot analyses. Scale bar represents 100μm. (e) In vivo xenograft tumor progression. Nude mice were injected i.p. with vector control cells or WNT7A overexpressing cells (B2 or E1). The images provide a direct view of the area in abdominopelvic cavity around the reproductive tract, and intestinal mesentery. Numbers of implanted tumors 10 weeks after i.p. injection are shown. Data are presented as average number of implants ± SEM. Individual tumors > 2 mm were calculated. * vs vector control, P<0.05.

