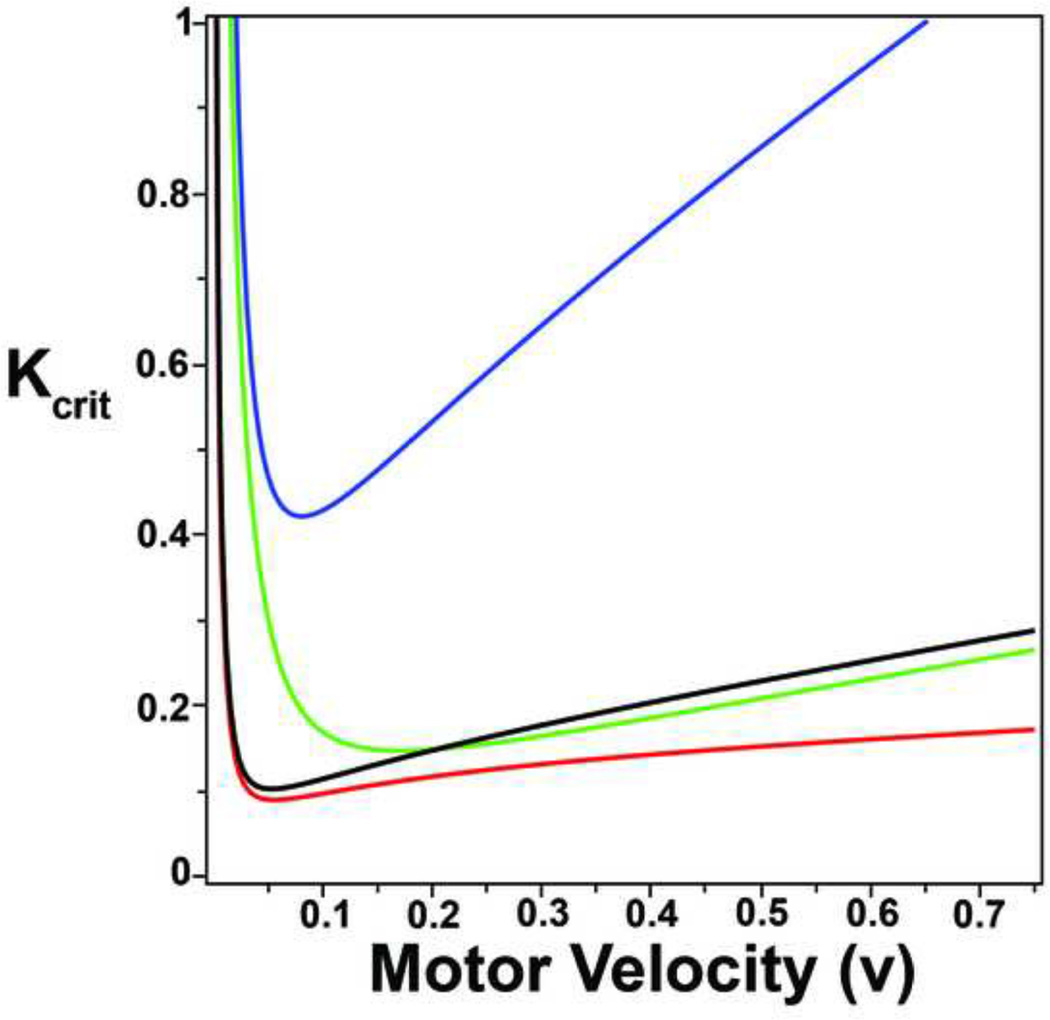
Figure D.1. Determining how Kcrit is a function of motor velocity.
Kcrit, shown in Equation 41 depends on all the variables of the model: motor velocity, and rates of attachment, detachment, and polymerization. The curves specifically show how Kcrit depends on motor velocity, but also how it depends on the three variable rates. The blue curve shows a low rate of attachment (r0=0.7), a low rate of detachment (r1=0.1), and a high rate of polymerization (r2=0.1). The rest of the curves are as follows: green (r0=0.7 (low), r1=0.4 (high), r2=0.025 (low)), black (r0=0.7 (low), r1=0.1 (low), r2=0.025 (low)), and red (r0=2.8 (high), r1=0.1 (low), r2=0.025(low)). Notice that the minimum value of Kcrit depends most on the sum of the rate of detachment and polymerization. The asymptotic approximation yields the range of motor velocities for which maximal alignment is expected.

