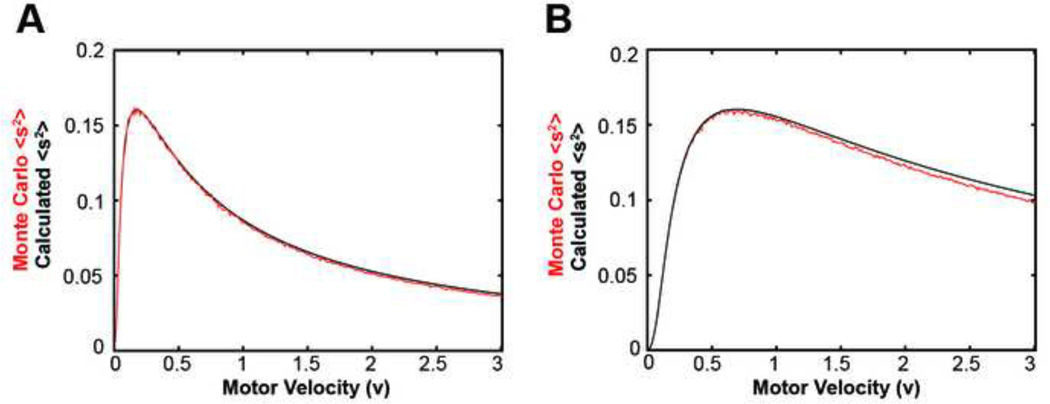
Figure 4. Monte Carlo simulations and continuum solution.
(A) Plot of the continuum solution’s calculation of <s2> (black) compared to the Monte Carlo simulation calculation of <s2> (red) for r0=0.4/s, r1+r2=0.15/s. (B) Plot of the continuum solution’s calculation of <s2> (black) compared to the Monte Carlo simulation calculation of <s2> (red) for r0=1.4/s, r1+r2=0.6/s.

