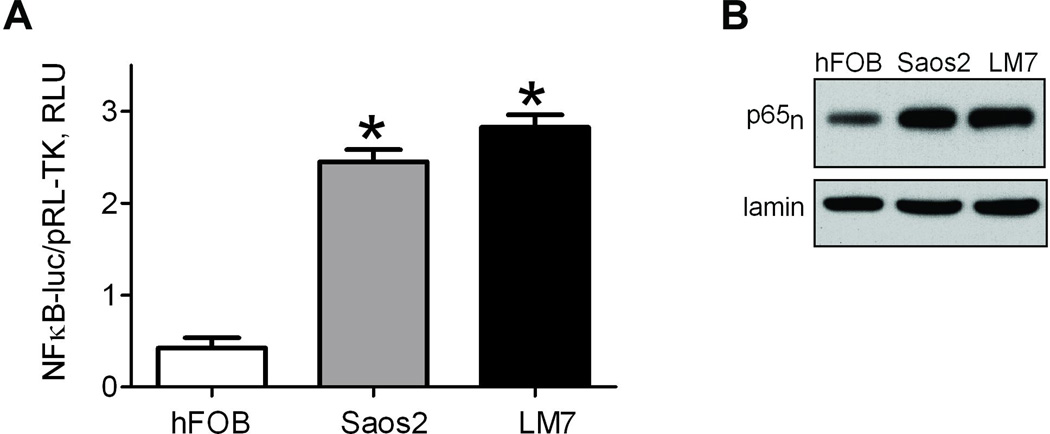
Fig. 1.
Activation of NF-κB in osteosarcoma cells. A) Intrinsic NF-κB activity measured in hFOB and osteosarcoma cells, Saos2 and LM7. Cells were transfected with NF-κB-luc reporter and promoterless pRL-TK to demonstrate NF-κB transcriptional activity. NF-κB induced firefly luciferase luminescence was compared to basally expressed renilla luciferase luminescence as a reference, and plotted as Relative Luminescence Units (RLU). Data are Means ± SE (n=4). *indicates P<0.05 when compared to control level in hFOB; B) Activation of NF-κB as determined by nuclear localization of NF-κB subunit, p65. Nuclear fractions from hFOB, Saos2, and LM7 were collected and the level of p65 protein was determined by Western Blot, with lamin as a loading control. Blot is a representative of 3.

