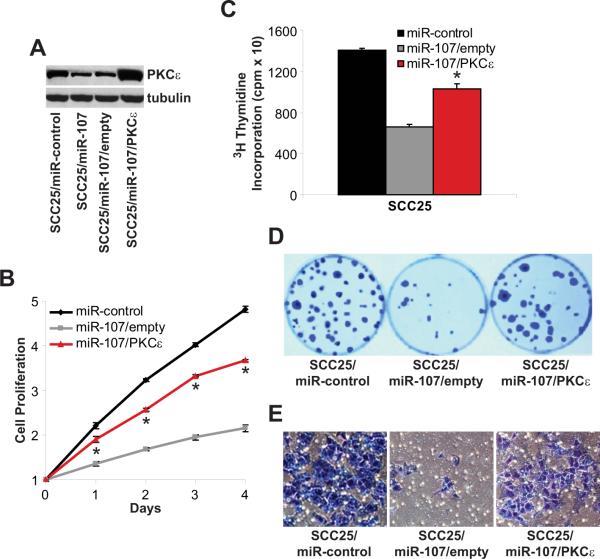
Figure 5. miR-resistant PKCε reverses the tumor suppressive actions of miR-107.
SCC25/miR-107 cells were transfected with an empty vector or a PKCε expression vector to generate SCC25/miR-107/empty and SCC25/miR-107/PKCε cells. A. PKCε levels. Whole cell lysates were extracted and western blot analysis was performed using anti-PKCε and anti-tubulin antibodies. B. Cell proliferation. Cell proliferation was measured using the MTT assay. Data is presented as mean ± SEM. *p-value<0.005, n=3. C. DNA synthesis. Incorporation of 3H-thymidine into DNA was monitored after 4 hours in a scintillation counter. Data is presented as mean ± SEM. *p-value<0.005, n=3. D. Colony formation. Colonies were stained with crystal violet and counted. E. Cell invasion. Cell invasion was assessed using the Modified Boyden chamber invasion assay with Matrigel basement membrane. Invasive cells were counted.

