
Figure 1. Schematic relationship between mask wearing and non-mask wearing individuals for pandemic (H1N1) 2009.
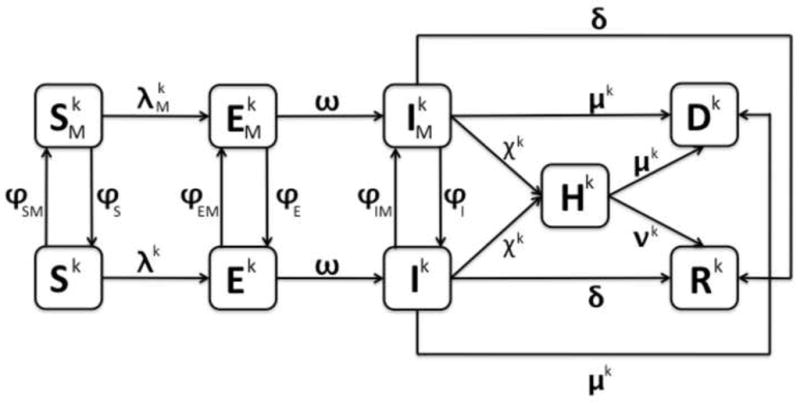
Note there are three different diagrams represented: k = 1 (ages 0–17), 2 (ages 18–64), and 3 (ages 65+). The arrows connecting the boxed groups represent the movement of individuals from one group to an adjacent one. Susceptible individuals (Sk or ) can either become exposed (Ek or ) or move between the non-mask wearing (Sk) or mask wearing ( ) susceptible groups. Exposed individuals (Ek or ) can either become infectious (Ik or ) or move between the non-mask wearing (Ek) and mask wearing ( ) exposed groups. Infectious individuals (Ik or ) can recover (Rk), die (Dk), be hospitalized (Hk), or move between non-mask wearing (Ik) and mask wearing ( ) infectious groups. Hospitalized individuals can either recover (Rk) or die (Dk).