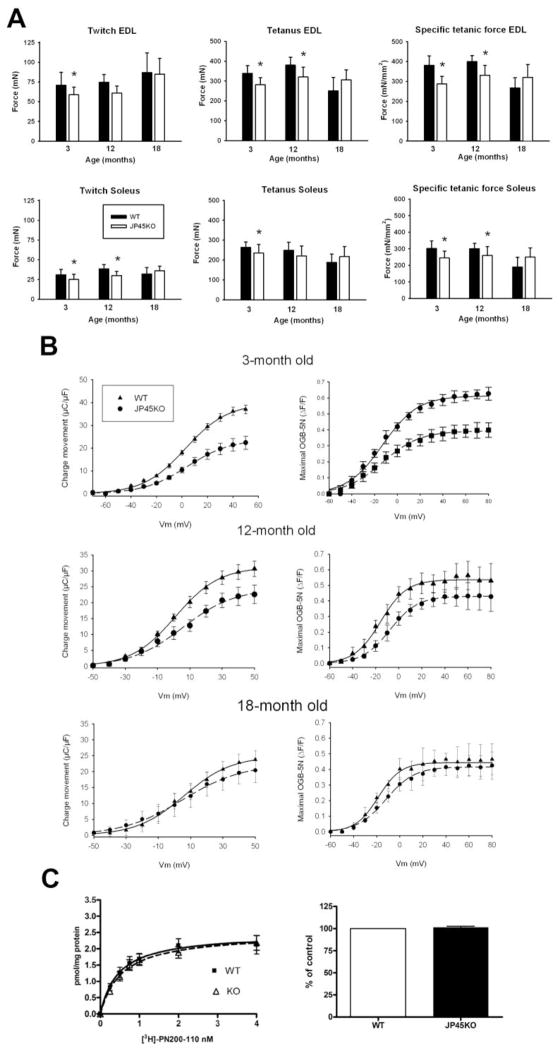
Figure 1. Skeletal muscle force, Cav1.1 charge movement and content in total SR membrane from JP45 KO and WT mice.
A. Twitch, tetanic force, and specific force recorded in WT and JP45KO EDL and soleus muscles. The number of muscles tested was: EDL WT 3 [months] = 17; EWT12 = 14; EWT18=12; soleus [S] WT 3=15; SWT 12=13; SWT18 =9; EDL JP45KO [KO] 3=16; EKO12=14; EKO18=16; SKO3 =14; SKO12 =15; and SKO18=11. Data points are expressed as mean ± SD. *ANOVA test P <0.05. Data for 3-month-old WT and JP45KO mice are from (Delbono et al., 2007). B. Cav1.1 charge movement recorded after blocking the inward Ca2+ current. Data points were fitted to equation 1. Table 2 shows bestfitting parameters. C. [3H]-PN200-110 binding assay. R1 fraction proteins from 18-month JP45KO and WT mice were separated by 7.5% PAGE, blotted, and stained with a peroxidaseconjugated antibody against albumin (see Methods). Albumin content was measured by densitometry of the protein band. Data of 20–24 determinations carried out in three different total SR fraction preparations. Data for 3-month-old mice are from (Delbono et al., 2007). Data points represent mean ± S.E.M.

