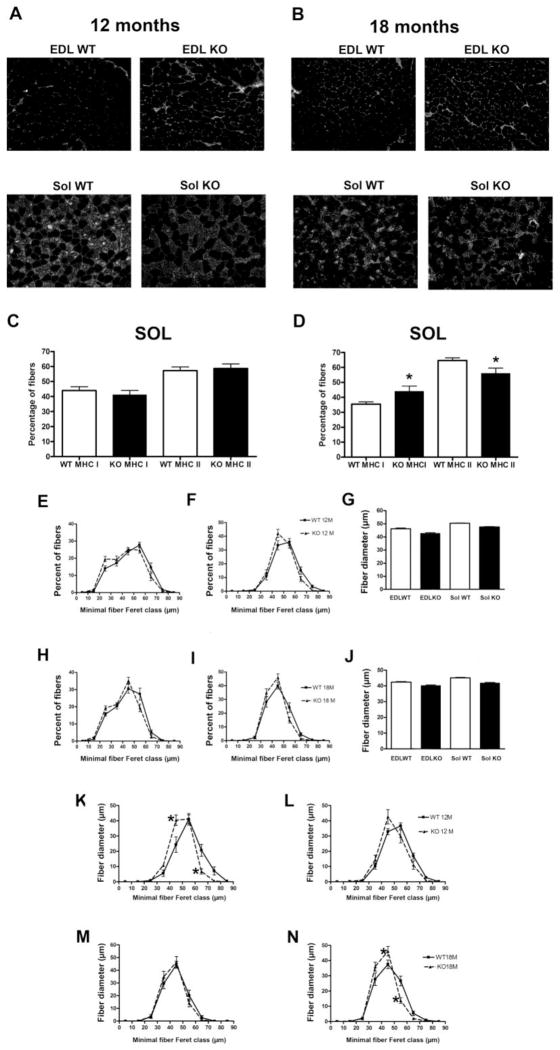
Figure 4. Fiber-type composition and fiber size in EDL and soleus muscle, and MHC fiber size distribution in soleus muscle from JP45 KO and WT mice.
Myosin-heavy chain I (MHCI) composition in EDL and soleus muscles from (A, C) 12- and (B, D) 18-month-old mice. Fiber-type composition determined by myosin-heavy chain (MHC) immunocytochemistry in E[DL] WT 12 [months]= 4; EWT18 = 4; S[oleus]WT12 = 4; SWT18 = 4; E[JP45]KO12 = 4; EKO18 = 4; SKO12 = 4; and SKO18 = 4. Asterisks indicate statistically significant differences between JP45KO and WT mice (P < 0.05). EDL (E) and soleus (F) fiber size distribution and average minimal fiber Feret (G) in 12-month JP45KO and WT mice. EDL (H) and soleus (I) fiber size distribution and average minimal fiber Feret (J) in 18-month JP45KO and WT mice. The number of fibers analyzed was: EWT12 = 1026; EKO12 = 1213; SWT12 = 869; SKO12 = 844; EWT18 = 1372; EKO18 = 1460; SWT18 = 1171; and SKO18 = 1377. MHC I distribution in (K) 12- and (C) 18-month JP45KO and WT mice and MHC II distribution in (L) 12- and (D) 18-month JP45KO and WT mice. For 12-month WT and JP45KO mice, the number of MHC I fibers studied was 376 and 220, respectively (A); MHC II fibers, 493 and 319, respectively (B). For 18-month WT and JP45KO mice, the number of MHC I fibers was 417 and 594, respectively (M); MHC II, 759 and 778, respectively (N). Values represent mean ± S.E.M.

