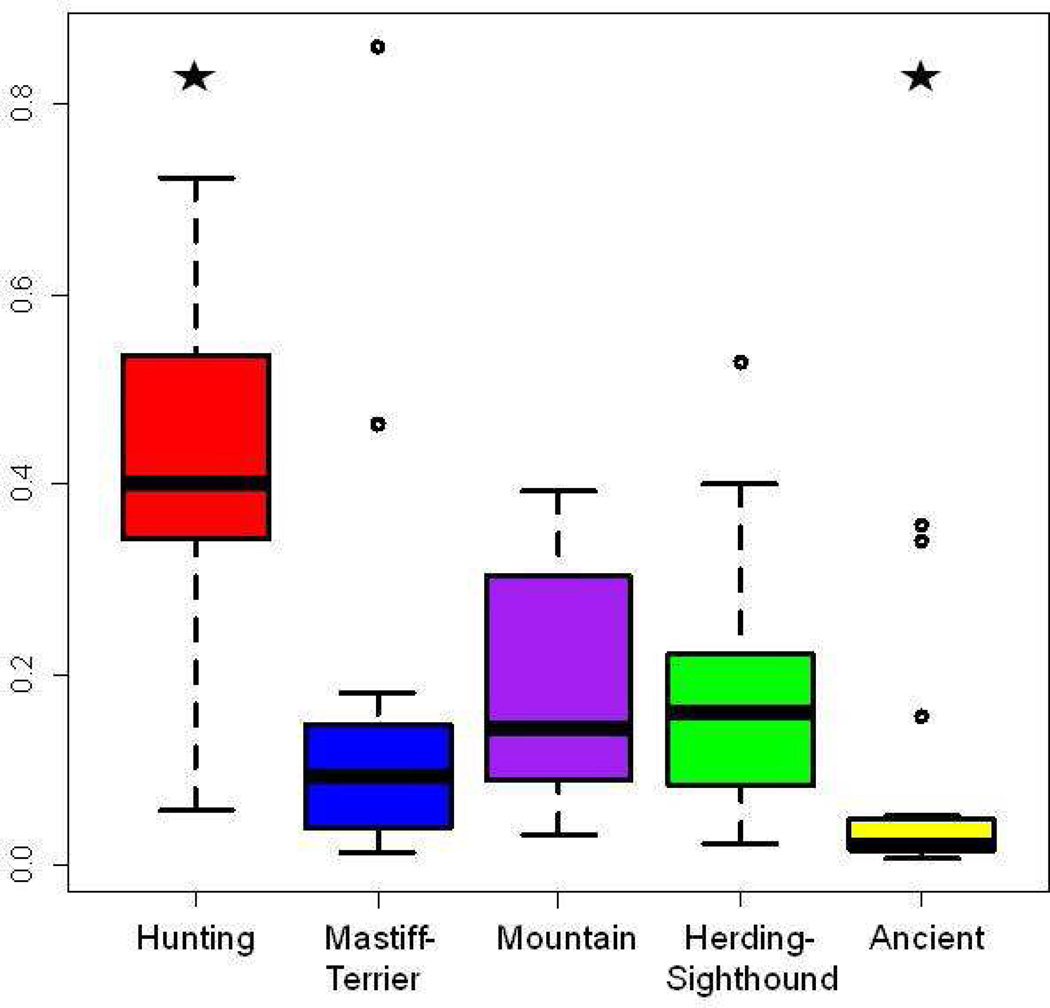
Figure 2.
Distribution of proportion membership in five primary breed clusters by breeds at risk for MMVD. 132 breeds were clustered into five populations using 96 microsatellite markers as described by Parker et al.44. Twenty breeds that have been designated at risk were extracted and their genomic proportion in each breed cluster plotted. The stars at the top of the graph indicate significant differences in the distributions: comparing the contribution of Hunting to Mastiff, Mountain, Herding, and Ancient : P= 1.37×10⁻⁵, 7.16×10⁻⁶, 3.41×10⁻⁶, and 4.56×10⁻¹⁰ respectively. The contribution of the Ancient group was also significantly lower than the Mountain and the Sighthound clusters with P=0.000655 and 0.003587 respectively. Breed groups are listed below the graph. The y-axis shows percent membership in each breed group.

