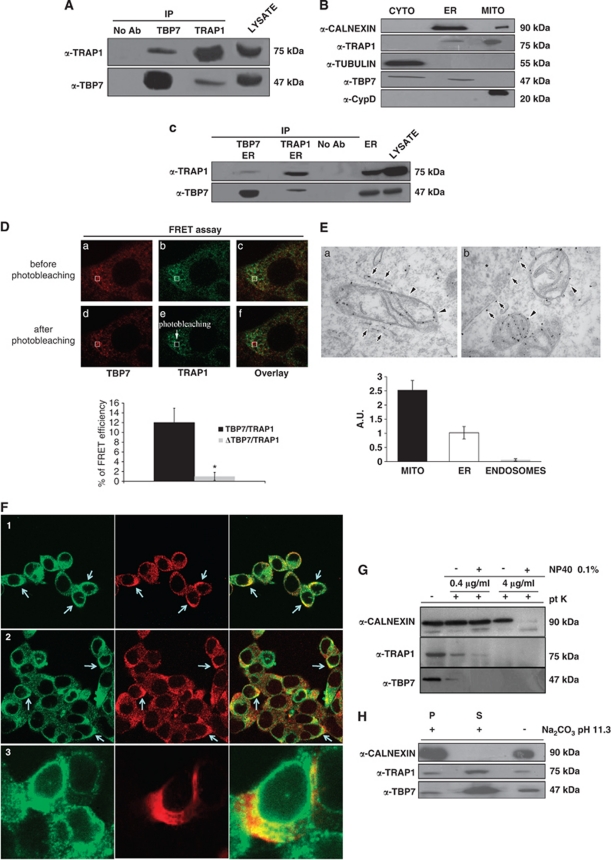
Figure 1.
TRAP1 and TBP7 interact and colocalize in the ER. (A) Total HCT116 lysates were harvested and immunoprecipitated using anti-TRAP1 and anti-TBP7 antibodies as described under Materials and Methods, separated by SDS-PAGE and immunoblotted using the indicated mouse monoclonal anti-TRAP1 and mouse monoclonal anti-TBP7 antibodies. No Ab, total cellular extracts incubated with A/G plus agarose beads without antibody; IP, immunoprecipitation using the corresponding antibodies. (B) Total HCT116 lysates were fractionated into MITO, CYTO and microsomal (ER) fractions as described under Materials and Methods, separated by SDS-PAGE and immunoblotted using mouse monoclonal anti-TRAP1 and mouse monoclonal anti-TBP7 antibodies. The purity of the fractions was assessed by using mouse monoclonal anti-tubulin, goat polyclonal anti-CypD, rabbit polyclonal anti-calnexin antibodies specific for the single subcellular compartments. (C) TRAP1 and TBP7 co-IP analysis on the microsomal fraction (ER), obtained as described under Materials and Methods. WB of immunoprecipitates was performed by using the indicated antibodies. (D) TRAP1/TBP7 direct interaction. FRET was measured by using the acceptor photo-bleaching technique as described under Materials and Methods. The images show the signal of TBP7 (red) and TRAP1 (green) before (a–c) and after photo-bleaching (d–f). The selected ROI for bleaching was indicated. Energy transfer efficiency was measured in cells transiently co-transfected with TRAP1 and either TBP7 or its mutant form (ΔTBP7-Flag), and is expressed in % as mean of three independent experiments. Error bars: ±S.D.; *P<0.0001. (E) ER Distribution of TRAP1 in HCT116 cells (EM). Cells expressing TRAP-HA vector were fixed and prepared for immuno-EM (see Materials and Methods). Labeling with the anti-HA antibody revealed significant amount of TRAP1 in mitochondria (a, b, arrowheads). In addition, TRAP1 was distributed throughout the elongated membrane profiles (a, arrows) that on the basis of their ultrastructural features (such as attached ribosomes) can be attributed to the rough ER compartment, and detected along the nuclear envelope (b, arrows). The density of immuno-gold labeling (in arbitrary units; average±S.D.) in mitochondria (MITO), ER and endosomes (as a negative control) is reported in the lower histogram. (F) ER TRAP1/TBP7 colocalization (confocal microscopy). Immunofluorescence shows colocalization of TBP7 with TRAP1 and with the ER protein calnexin. In Panel-1, a double immunofluorescent staining is shown for TRAP1 (green) and TBP7 (red). In Panel-2, a double immunofluorescent staining is shown for calnexin (green) and TBP7 (red). In cells expressing the Myc-tagged TRAP1 construct (red) the protein co-distributes to a great extent with endogenous calnexin (green, Panel-3). (G and H) Biochemical characterization of TRAP1/TBP7 ‘topology' in the ER. WB of HCT116 microsomal fractions treated with 0.4 μg/ml or 4 μg/ml proteinase-K (pt K) ±1% NP-40 for 20 min on ice (G) or with 100 mM Na2CO3 (pH 11.3) for 30 min (H) as described under Materials and Methods. Specific proteins were revealed using the indicated antibodies. (H): S, supernatant; P, pellet

