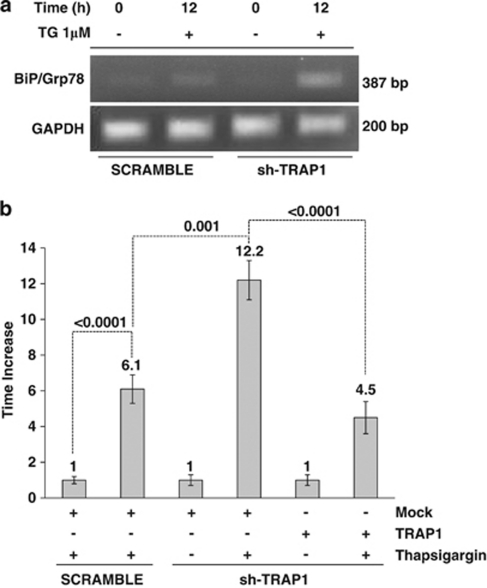
Figure 2.
BiP mRNA levels in sh-TRAP1 stable clones. (a) Semi-quantitative RT-PCR analysis of BiP/Grp78 mRNA expression in sh-TRAP1 stable clones with respect to scrambled transfectants after 12-h treatment with 1 μM TG. As control, the levels of GAPDH transcript were analyzed. (b) Real-time RT-PCR analysis of BiP/Grp78 mRNA expression in scrambled and sh-TRAP1 HCT116 cells exposed to 1 μM TG for 12 h and in sh-TRAP1 HCT116 cells transfected with TRAP1 cDNA before treatment with TG. The P-values indicate the statistical significance between different BiP/Grp78 levels under the indicated conditions

