Figure 3.
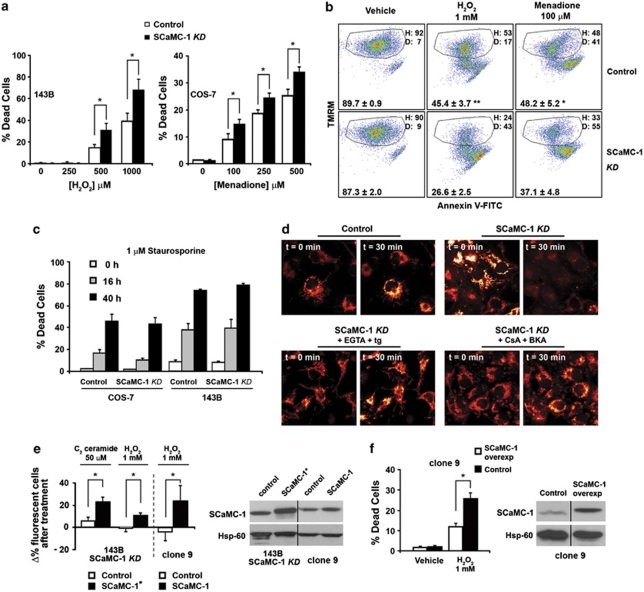
. SCaMC-1 selectively protects from oxidative stress-induced cell death. (a) Left panel: Control and SCaMC-1-KD 143B cells were incubated with H2O2 for 6 h and cell death was evaluated by confocal microscopy after 1 μM calcein-AM and 2 μM PI staining. Right panel: Control and SCaMC-1-KD COS-7 cells were incubated with menadione for 2 h and cell death was evaluated by flow cytometry after PI staining (mean±S.E.M., n=6 and 5, respectively; *P<0.05). (b) Control and SCaMC-1-KD 143B cells were incubated with 1 mM H2O2 for 3.5 h or with 100 μM menadione for 1 h and cell death was evaluated by flow cytometry after TMRM and Annexin-V–FITC staining. A representative experiment is shown where H indicates the percentage of healthy cells (positive for TMRM and negative for Annexin-V, delimited by the quadrant) and D indicates the percentage of dead cells (negative for TMRM and positive for Annexin-V). The number at the bottom of each panel indicates the percentage (mean±S.E.M., n=6) of healthy cells. **P=0.00031; *P=0.014. (c) Control and SCaMC-1-KD COS-7 and 143B cells are equally sensitive to 1 μM staurosporine-induced cell death. Cells were treated with the drug for 0, 16 or 40 h, and death was evaluated by flow cytometry after PI and Annexin-V–FITC staining. (d) SCaMC-1-KD cells are more vulnerable to phototoxicity-induced oxidative stress. Control and SCaMC-1-KD COS-7 cells were loaded with 100 nM TMRM; illuminated with 10% laser power of the 543 nm He–Ne line of the confocal system; and collapse of mitochondrial ΔΨ was monitored over time. Lower left panels: SCaMC-1-KD cells were treated with 100 μM EGTA and 1 μM thapsigargin. Lower right panels: Cells treated with 5 μM CsA and 50 μM BKA. The figure shows representative images of at least three independent experiments. (e) Sensitivity of SCaMC-1-overexpressing 143B SCaMC-1-KD cells (left panel) and liver clone-9 cells (right panel) to mPT-dependent cell death. Cells were transiently transfected with GFP, or with GFP and SCaMC-1, and exposed to C2 ceramide or H2O2 for 6 h. The bar shows the change in the percentage of GFP fluorescent cells (as compared with total cell number) after the treatment.21 An increase in this percentage as compared with control transfections indicates protection by SCaMC-1. The right panel shows the increase in SCaMC-1 expression after the transfection. SCaMC-1*: Rescue construct with synonymous mutations (see the Supplementary Materials and Methods). (f) Control and stable SCaMC-1-overexpressing liver clone-9 cells were incubated with H2O2 for 3 h and cell death was evaluated by flow cytometry after PI staining (mean±S.E.M., n=3; *P<0.05). The right panel shows the increase in SCaMC-1 expression in the stable SCaMC-1-overexpressing clone

