Figure 4.
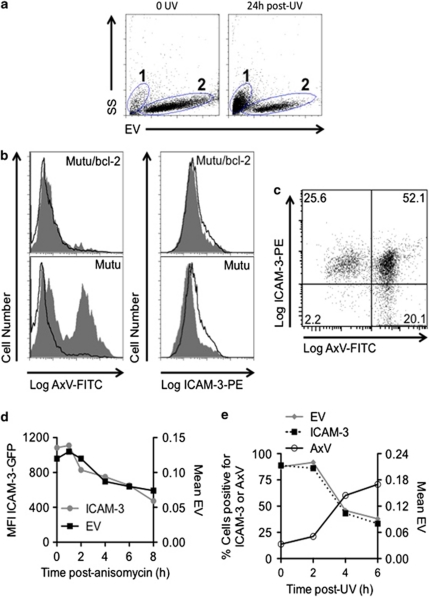
Cell-surface ICAM-3 levels reduce during apoptosis in line with a loss of cell volume. (a) Electronic volume versus side scatter flow cytometric dot plots of Mutu BL cells at 0 h (left) or 24 h (right) post UV. Region 1 cells are necrotic and late apoptotic whereas region 2 cells are live or early apoptotic. (b) Mutu BL cells or Bcl-2-transfected counterparts (Mutu/bcl-2) were irradiated with UV (100 mJ/cm2) and 4 h post UV were assessed in parallel for PS exposure (using AxV-FITC staining) and ICAM-3 expression (using direct immunofluorescence with anti-ICAM-3-PE) of cells within zone 2 (live/early apoptotic cells). Grey profiles show staining of irradiated cells whereas clear profiles show nonirradiated cells. UV-treated Mutu but not Mutu/bcl2 cells show high level of PS exposure and reduced levels of ICAM-3. (c) UV-induced Mutu BL stained for both ICAM-3 expression (ICAM-3-PE) and PS exposure (AxV-FITC) shows PS-exposing cells (in region 2 – live/early apoptotic) preferentially express reduced ICAM-3. (d) HeLa cells expressing ICAM-3–GFP were assessed for cell volume and ICAM-3–GFP expression over time following induction to apoptosis with anisomycin (5 μg/ml). (e) Mutu BL cells were induced to apoptosis with UV and the percentage of cells positive for ICAM-3 (assessed using anti-ICAM-3-PE and flow cytometry) was compared with cell volume (electronic volume (EV)) and PS exposure (AxV). Data shown are collected from at least 5000 events and are representative of at least three similar experiments

