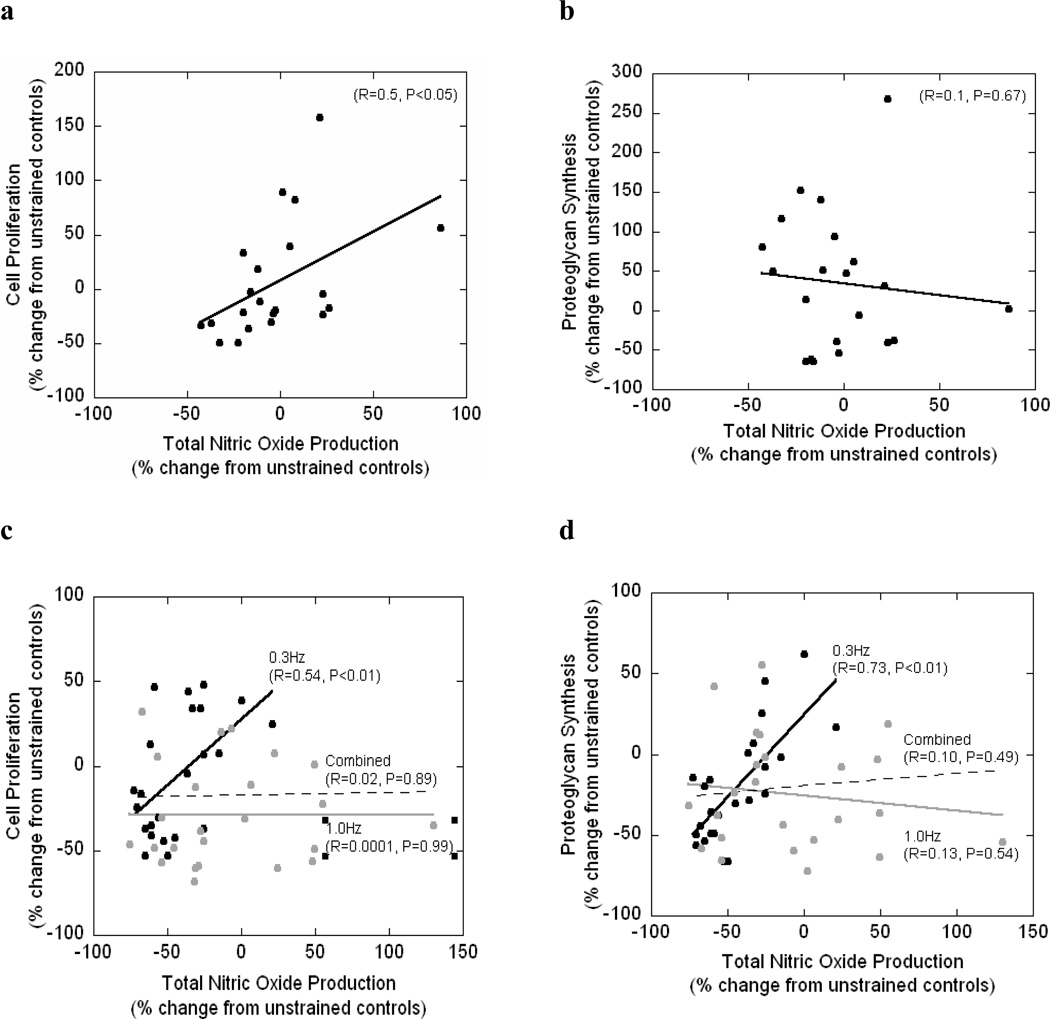
Figure 5.
Regression analysis for cell proliferation as a function of total NO production (a,c) or proteoglycan synthesis as a function of total NO production (b,d) for statically strained PEG constructs (a,b) and dynamically strained PEG constructs (c,d). For panel c and d, regression analysis was performed for 0.3Hz dynamically strained gels (black circles, black line) and for the 1.0Hz dynamically strained gels (gray circles, gray line) and for both frequencies combined (dotted line).

